Set Up Monitoring Tools for Kubernetes using Prometheus and Lens

I am DevOps Engineer with 1 plus year of experience. I am 2x AWS certified and also Terraform Certified. I have good knowledge in DevOps tools like Docker, Kubernetes, Linux, Git, Terraform etc.
PROMETHEUS:
Prometheus is an open-source systems monitoring and alerting toolkit originally built at SoundCloud.
Features of Prometheus
Prometheus’s main features are:
A multi-dimensional data model with time series data identified by metric name and key/value pairs
PromQL, a flexible query language to leverage this dimensionality
No reliance on distributed storage; single server nodes are autonomous
Time series collection happens via a pull model over HTTP
Pushing time series is supported via an intermediary gateway
Targets are discovered via service discovery or static configuration
Multiple modes of graphing and dashboarding support
Components
The Prometheus ecosystem consists of multiple components, many of which are optional:
the main Prometheus server which scrapes and stores time series data
client libraries for instrumenting application code
a push gateway for supporting short-lived jobs
special-purpose exporters for services like HAProxy, StatsD, Graphite, etc.
an alert manager to handle alerts
various support tools
Prometheus Architecture
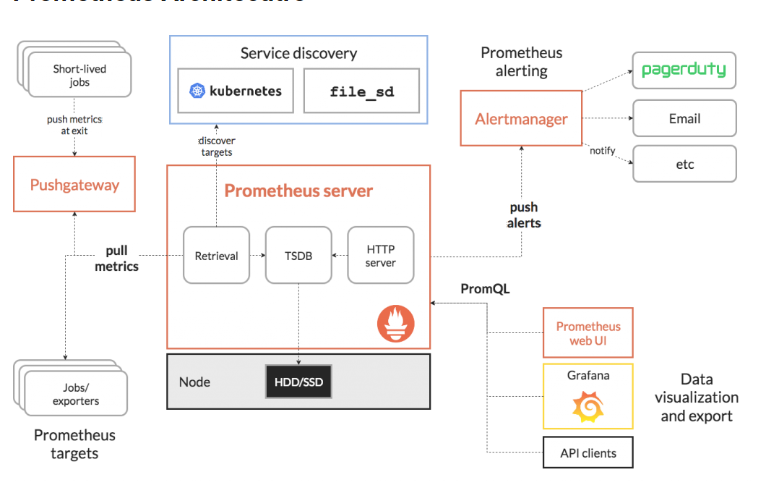
How Prometheus Works?
Prometheus collects data in the form of time series. The time series are built through a pull model:
The Prometheus server queries(scrape) a list of data sources (sometimes called exporters) at a specific polling frequency
Prometheus data is stored in the form of metrics, with each metric having a name that is used for referencing and querying it
Prometheus stores data locally on disk, which helps for fast data storage and fast querying but ability to store metrics in remote storage.
Each Prometheus server is standalone, not depending on network storage or other remote services.
Prometheus Installation using helm chart
Note:
Make sure you have installed Helm cli, if not you can refer this link ( helm cli ). Your Kubernetes Cluster should be up and running. If the Kubernetes cluster is not configured then refer to this blog for AKS Cluster provisioning.
Steps:
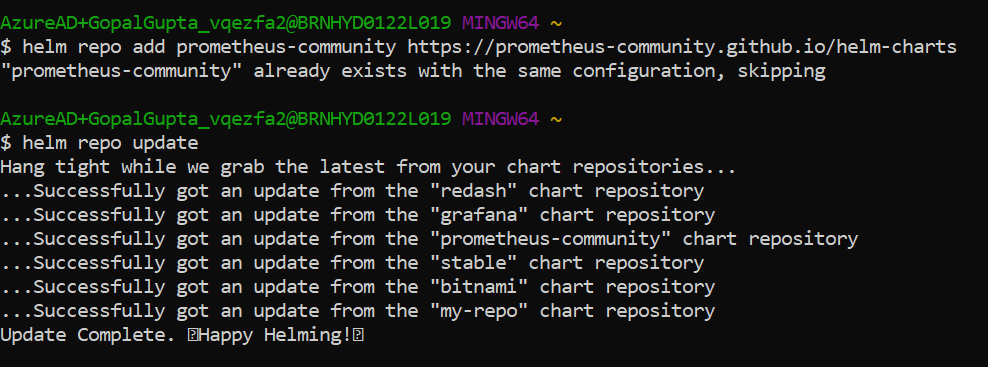
Run the below command.
\>> helm repo add prometheus-community https://prometheus-community.github.io/helm-charts
\>> helm repo update
\>> helm install [RELEASE_NAME] prometheus-community/prometheus
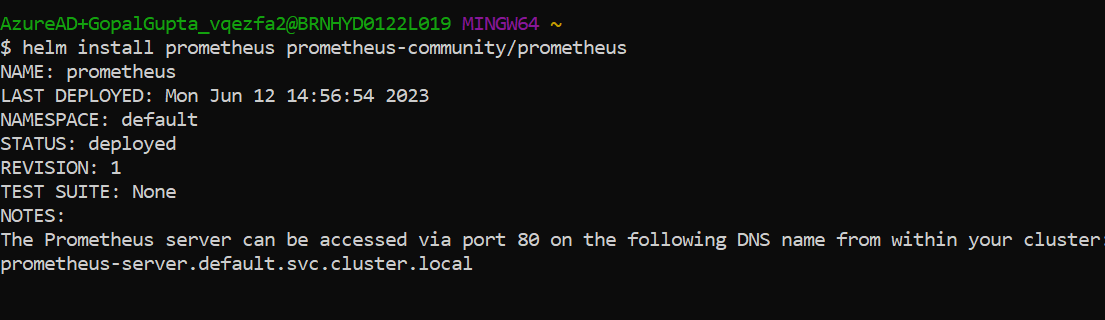
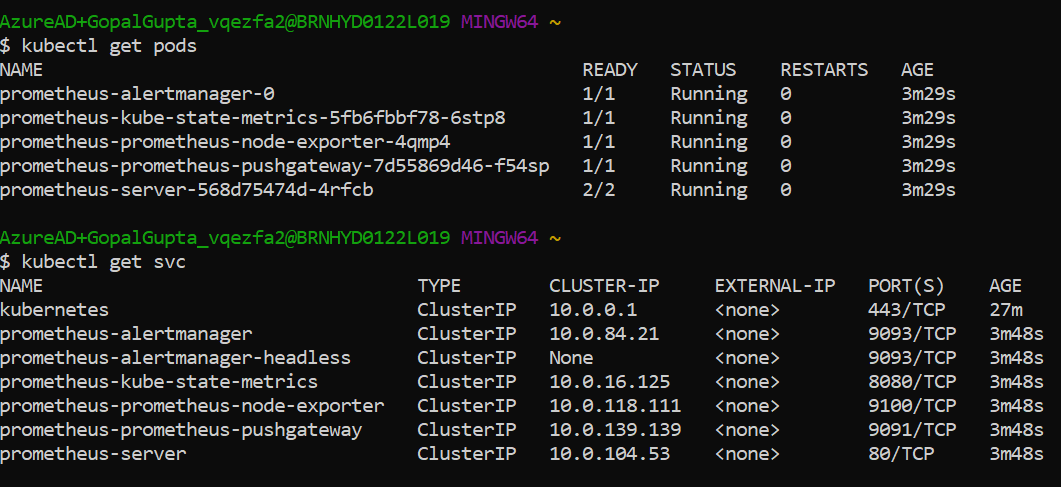
You can see Prometheus had been installed in your cluster.
\>> kubectl get pods
In order to access it externally we need to change the service type from cluster-IP to Loadbalancer. Expose the prometheus-server using the below command
\>> kubectl expose service prometheus-server --type=LoadBalancer --target-port=9090 --name prometheus-server-external
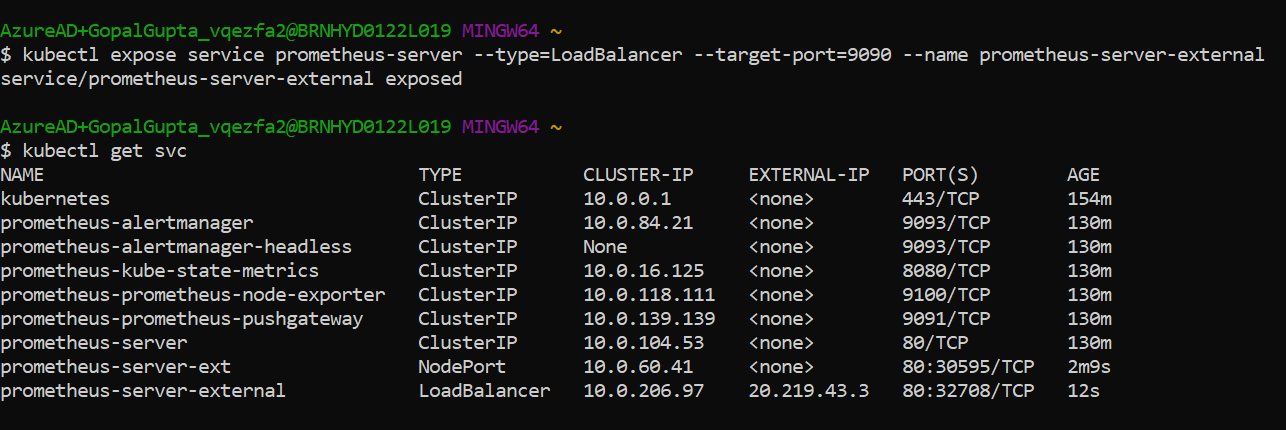
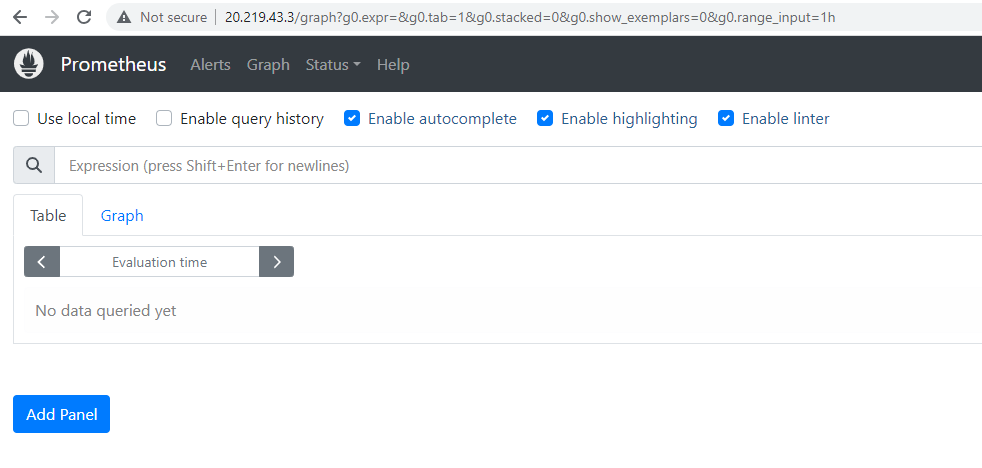
Copy the External IP and paste it into Your Browser. Your Prometheus Server is Up and running.
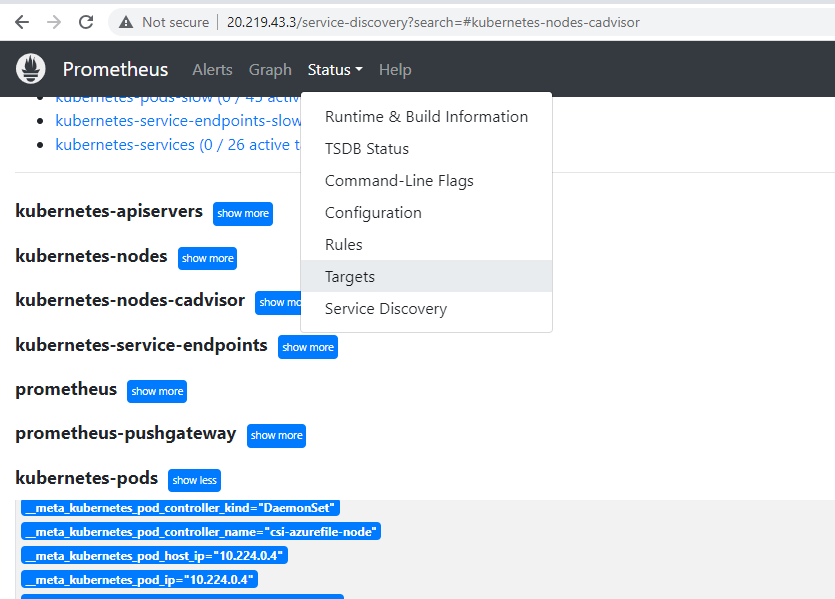
To view the metrics of kubernetes cluster like pods metrics, services metrics etc. Go to status --> targets. You can view the metrics.
What is lens?
Kubernetes Lens is an integrated development environment (IDE) that allows users to connect and manage multiple Kubernetes clusters on Mac, Windows, and Linux platforms. It is an intuitive graphical interface that allows users to deploy and manage clusters directly from the console.
Configuration Of lens
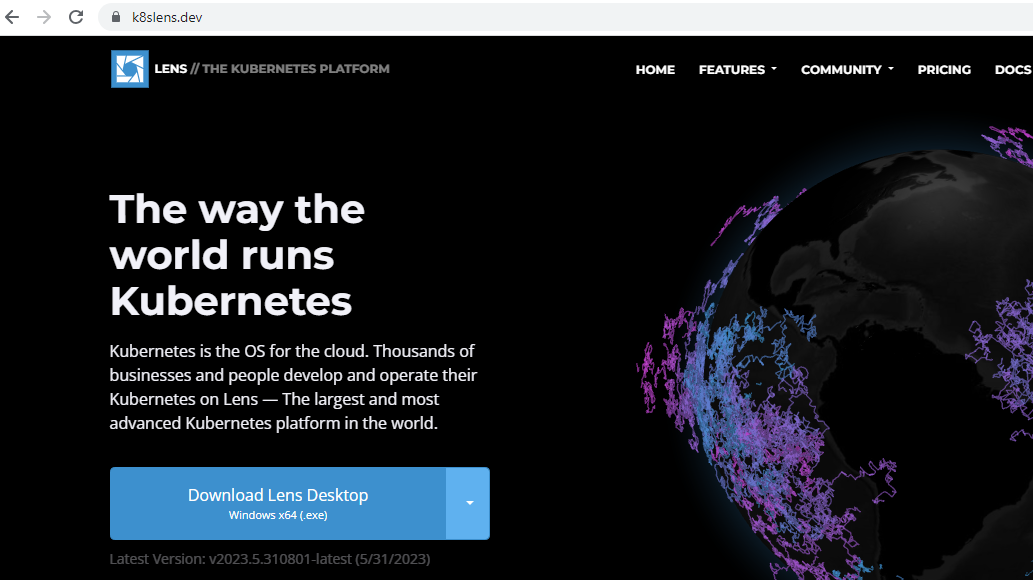
Go to https://k8slens.dev/ --> Download lens Desktop.
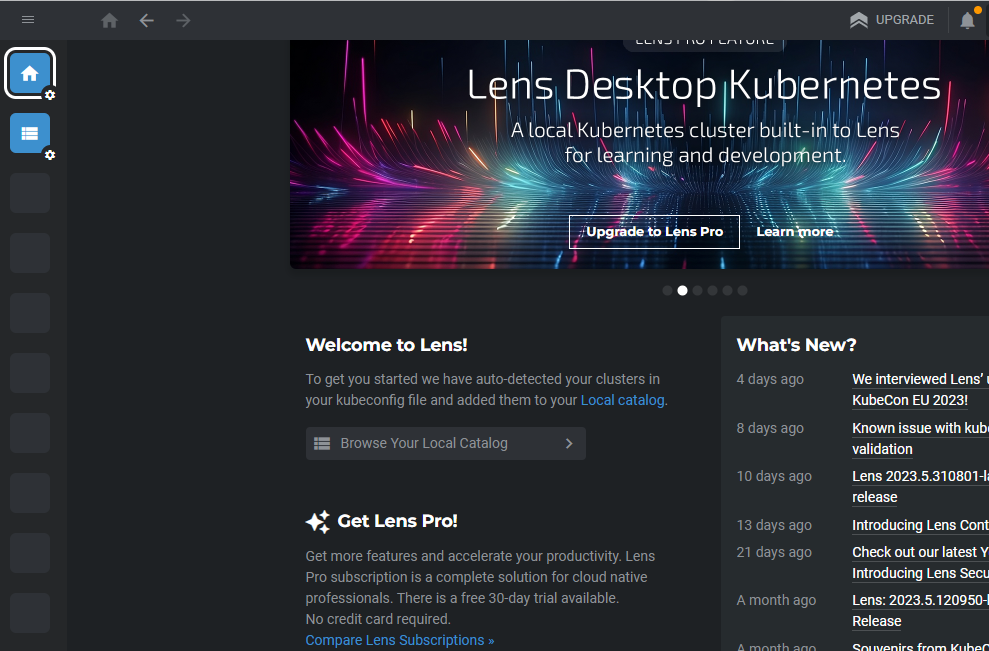
After you download and sign in to the desktop app. This is how it looks like after login.
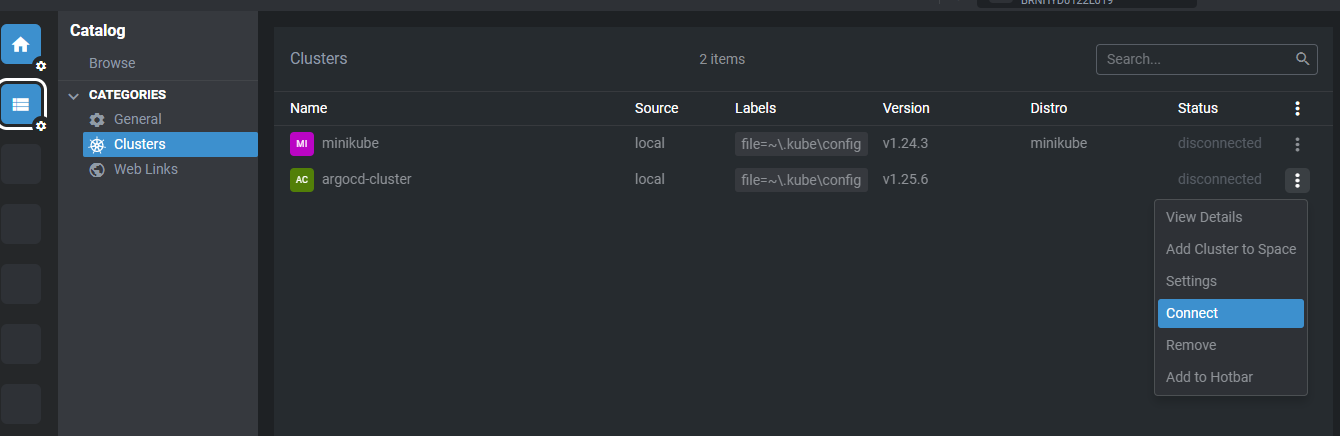
In order to add your cluster, Go to catalog -->clusters --> select your cluster name (it will automatically show the cluster name if there is any cluster present) --> connect.
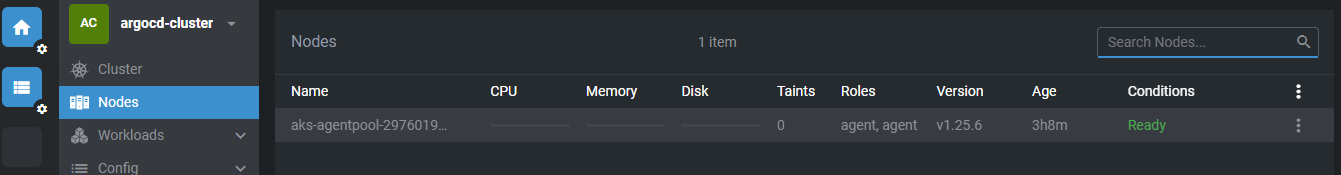
To view your webapp running on pod, Go to nodes --> select your Name of your pod.
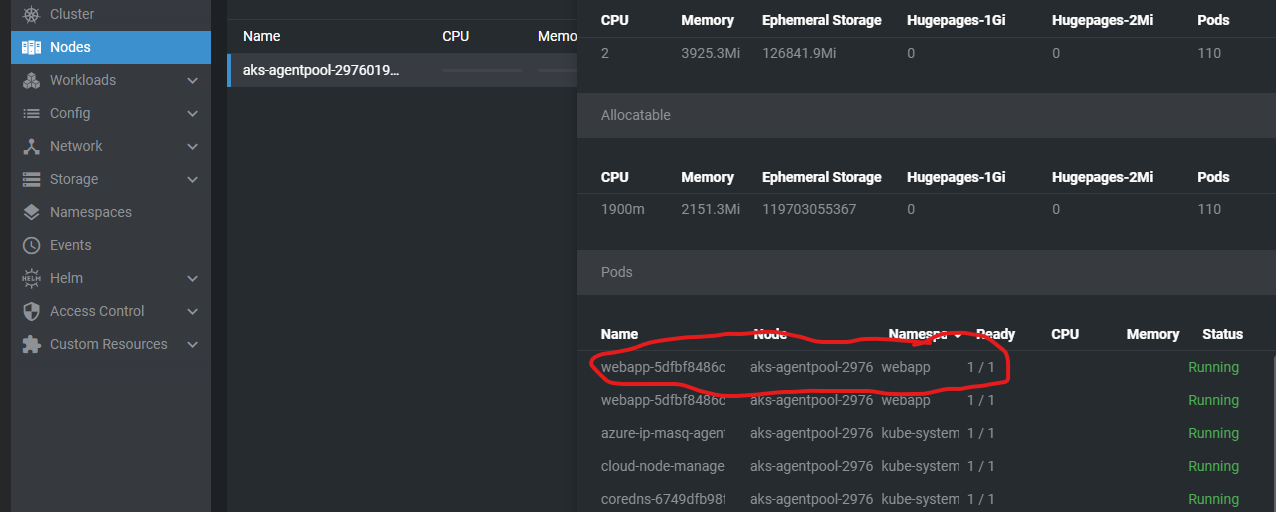
After you choose your pod. Click on Ports link. It will redirect to the localhost where your app is running.
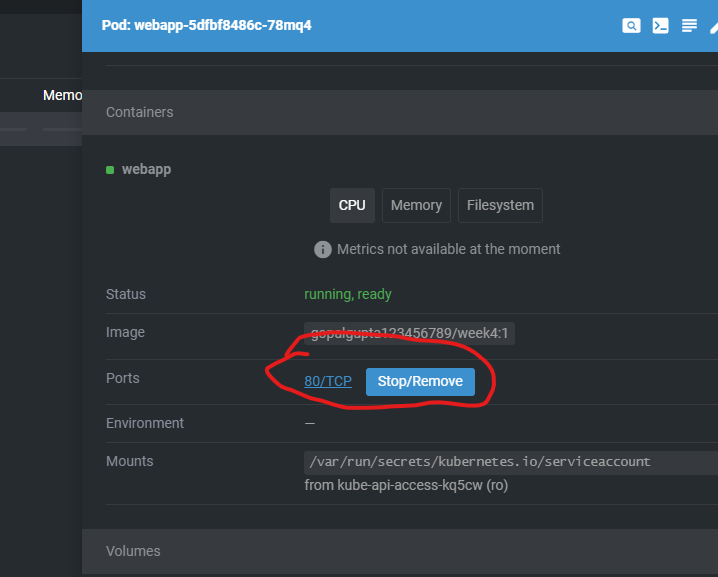
It will open the web page in your local browser
This is how you can setup monitoring tools for Kubernetes.
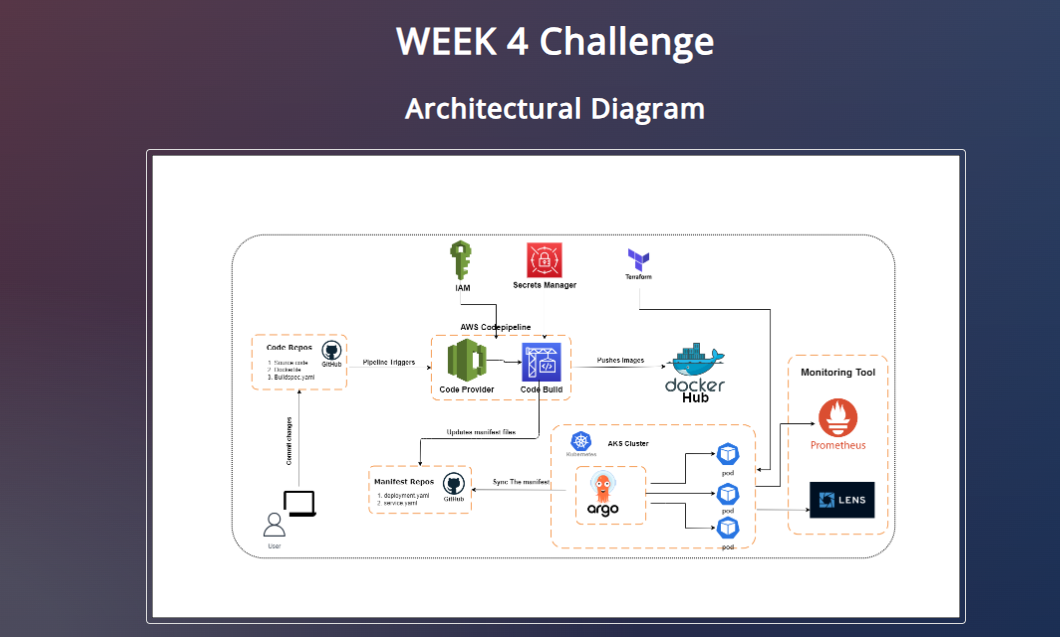
This is PART IV of my blog " Deploy a Web App to an AKS Cluster using AWS Codepipeline and ArgoCD " Please do checkout this blog for more details.
Thank You for reading my Blog. Happy Learning!!!


